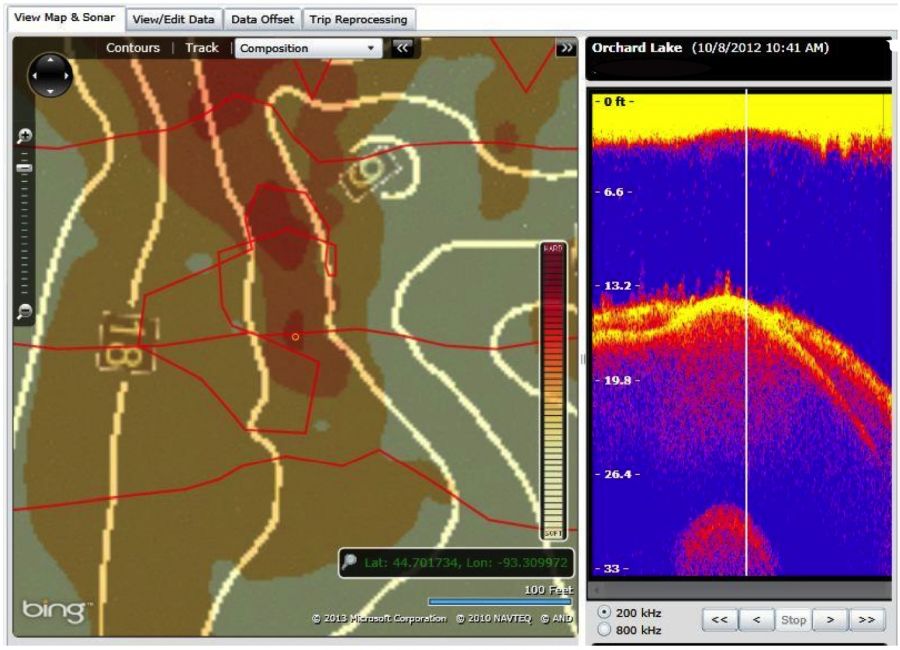
A map of bottom hardness is also created along with bathymetry and vegetation data layers as long as users travel less than 6 mph while logging data and the signal passes other QC controls. The hardness data is on a relative scale that ranges from 0 (soft) to 0.5 (hard).
Soft bottoms include muck and densely vegetated areas. Hard bottoms are sand, gravel, and rock (see below). Through initial testing, the breaks for soft and hard appear at 0.2 and 0.4 respectively. Values in between represent medium hardness (e.g., clay, thin layer of muck over hard bottom).
Like vegetation, hardness typing is more difficult on steep slopes than relatively flat bottoms. Confidence in bottom hardness classifications increases if users travel parallel along steeply sloping areas.
(AS SEEN IN GRAPHIC - Patch of hard bottom surrounded by softer overlying muck. Red dot on the left represents location of the sonar on the right.)
Now serving Greenville SC, Spartanburg SC, Asheville NC, Charlotte NC, Winston-Salem NC, & Greensboro NC areas.
Get started. Become a member today!
